


We often hear from organizations like yours that measuring the success of your training program can be challenging and time-consuming. With limited L&D resources and budget, as well as tools that can be less than intuitive, training professionals are often left to go on gut feeling or anecdotal feedback. In fact, in a recent OpenSesame customer survey, 40% of organizations reported difficulty in collecting meaningful data as a top challenge in measuring the success of their training program.*
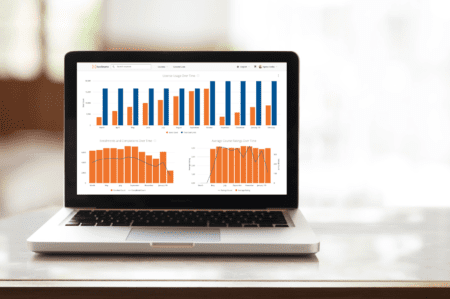
Good news—it’s about to get a whole lot easier. We’ve added a new dashboard and enhanced reporting to help you glean meaningful insights and course correct where necessary. Coming this fall to OpenSesame Plus customers and early in 2019 for other license options, Insights includes the Activity Report and a powerful new dashboard that will at-a-glance show you meaningful metrics like percentage of seats used, enrollments per learner, percentage of courses completed, and the average rating for courses taken.

Need more detail? You’ll be able to select a specific date range and see key information over time including:
-
License usage
-
Enrollments and completions
-
Most active and least active learners
-
Most used and highest-rated courses
-
Least used and lowest-rated

To access the Insights dashboard, you will log into your OpenSesame account and select My Insights from the menu. You’ll be able to identify areas of improvement, like poorly-performing courses, and our outstanding Curation and Customer Success teams are here to help you find replacements your learners will love. Because our catalog includes a variety of styles and formats, we have the courses you need to keep your learners engaged and keep your training program on track.
For more information contact your Customer Success Manager or our Customer Support team.
*TechValidate survey of 65 users of OpenSesame, 28 May, 2018